When SSR Became the Bottleneck
We had auto scaling enabled on our ECS service. Three tasks running, health checks passing, load balancer targets all green. On paper, the system was ready to handle traffic spikes. Then, on April 6, traffic spiked - and the service still degraded badly.
What the charts showed
The ECS dashboard for our web service on the apple-game-v2 cluster showed the full picture. All 3 tasks were running. All 3 load balancer targets were healthy. From the platform's perspective, everything looked fine.
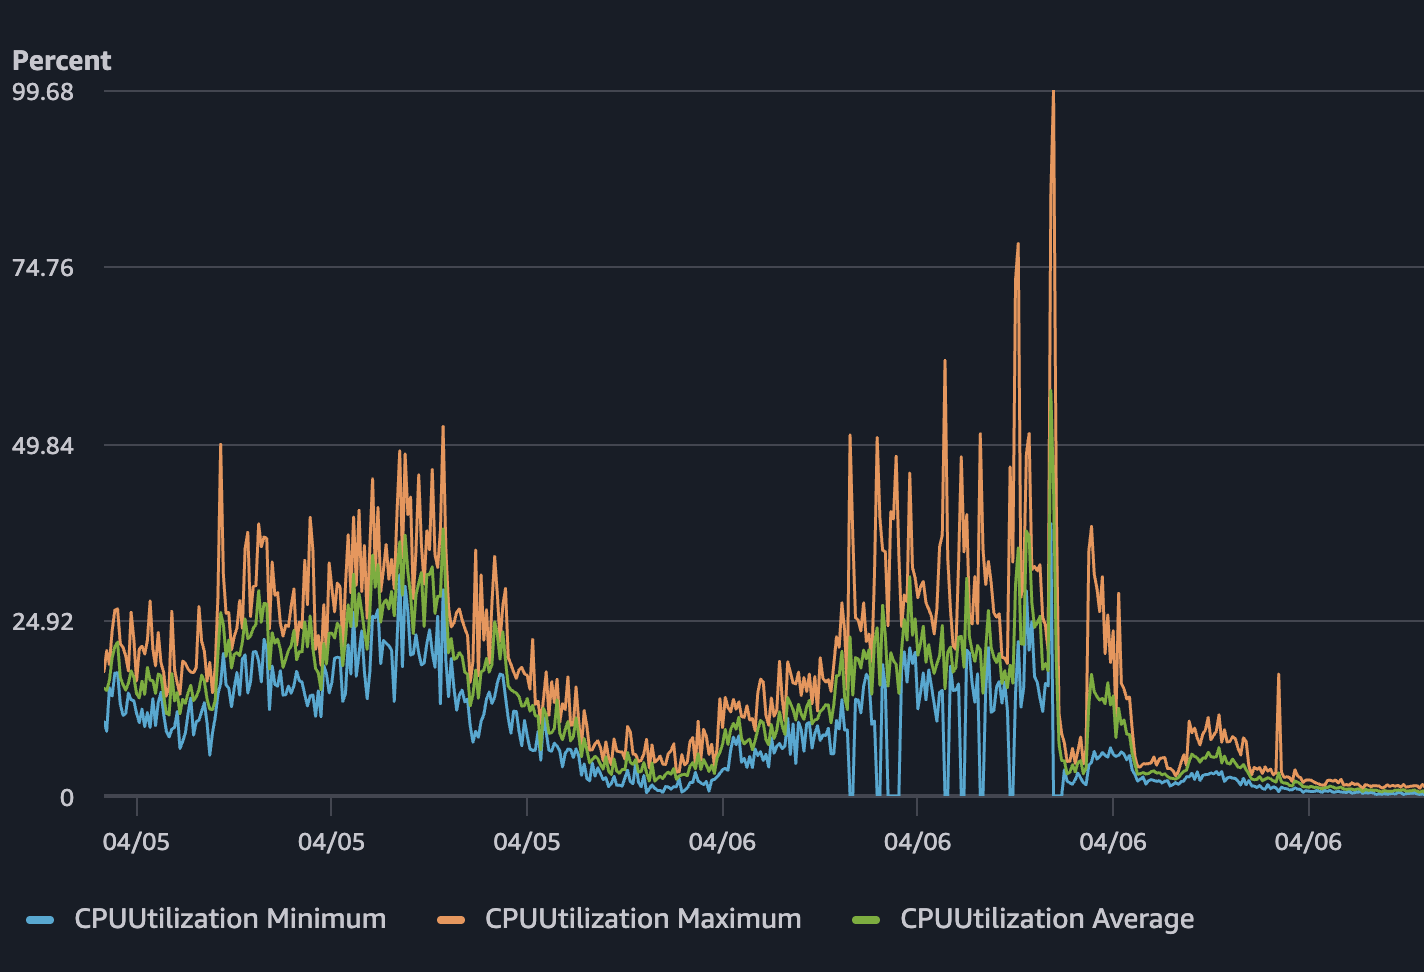
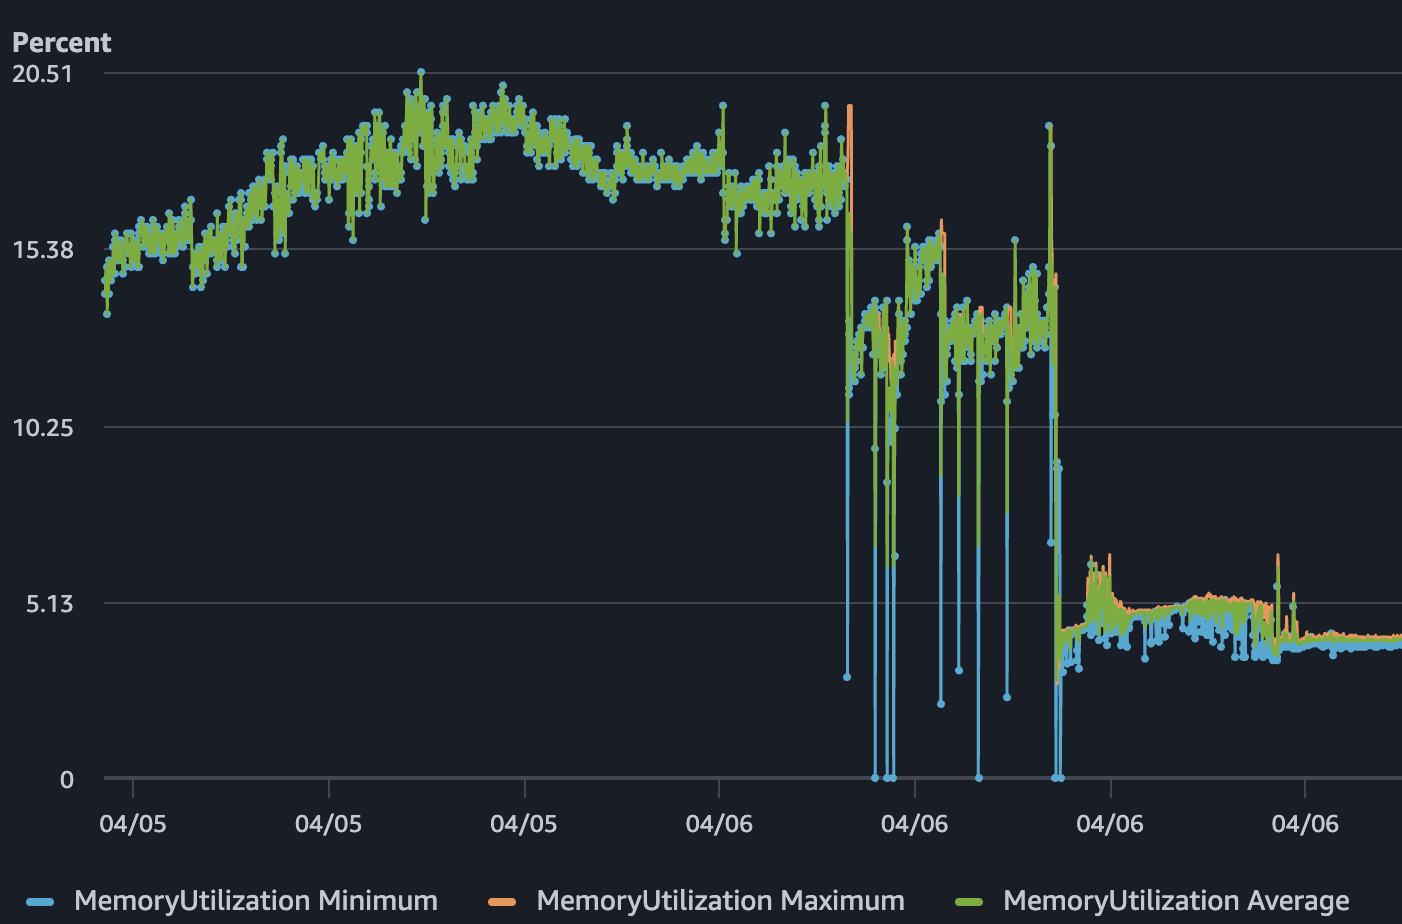
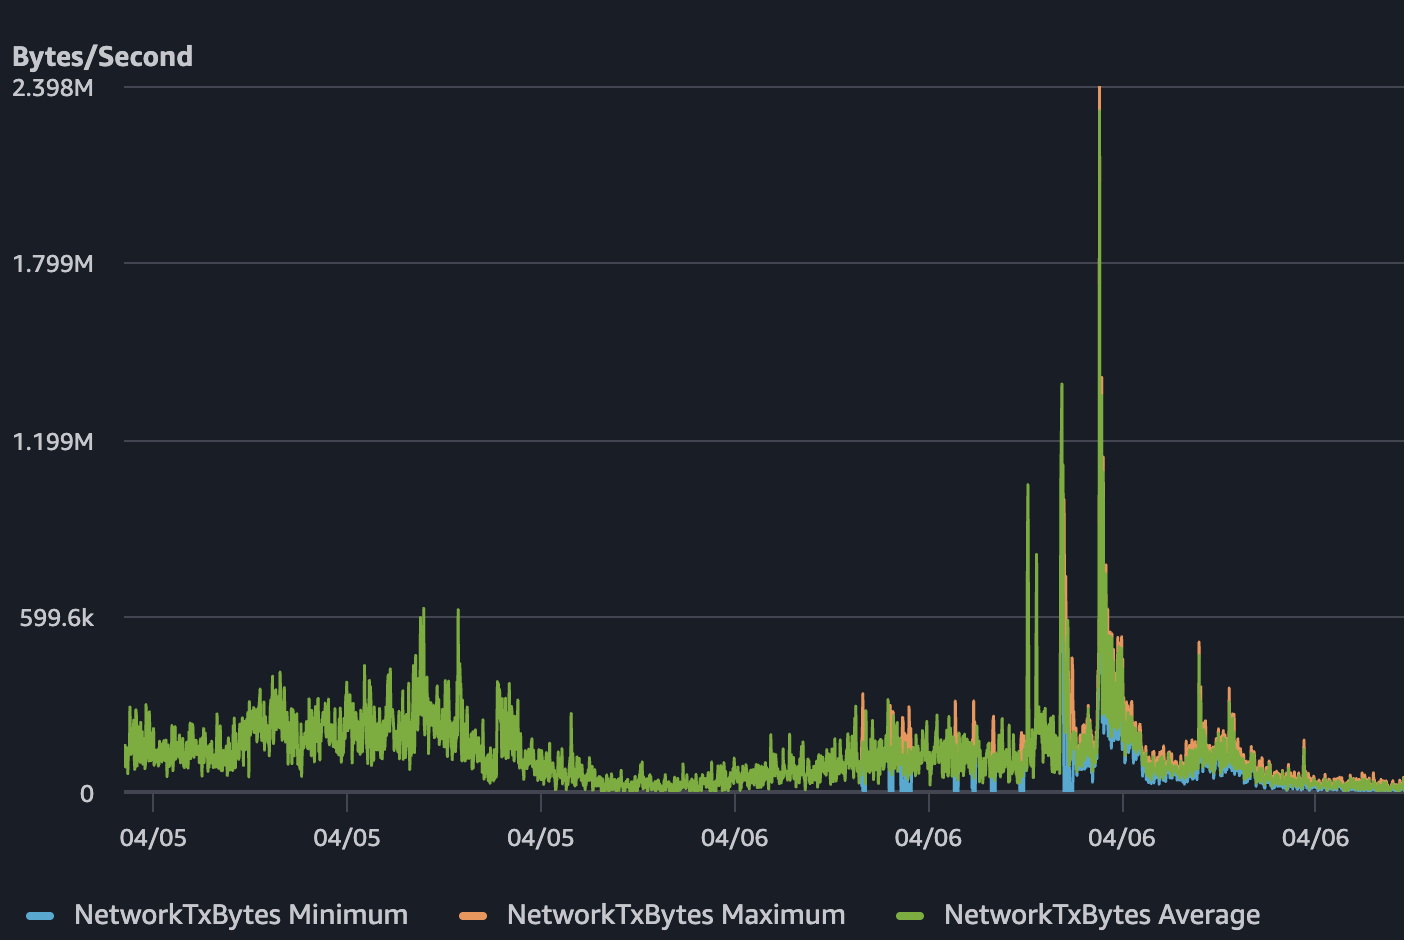
But CPU utilization on April 6 climbed close to 100%. Network TX spiked to roughly 2.4 MB/s. Memory was around 15% - not the bottleneck. The service was alive, but it was choking. Users experienced slow responses and timeouts while the health checks kept saying everything was healthy.
Why SSR was the real bottleneck
Server-side rendering had been applied too broadly - almost by default. Every page request paid for a full render cycle on the server: building the component tree, serializing HTML, sending it down. We had treated this as free. It was not.
Under normal traffic, the cost was invisible. Under a spike, it became the entire problem. Each SSR request consumed meaningful CPU time. With enough concurrent requests, 3 tasks running 0.5 vCPU each simply ran out of headroom. The CPU graph didn't lie - the work was real and per-request.
Why auto scaling didn't save it
Auto scaling is reactive. It watches metrics, crosses a threshold, decides to add capacity, launches new tasks, waits for health checks to pass, and then registers them with the load balancer. That process takes minutes, but traffic spikes happen in seconds. By the time new tasks could have come online, the existing tasks were already saturated. Auto scaling can add capacity later. It cannot erase expensive request paths in the moment. And when every single request is expensive, more tasks only push the problem a few minutes into the future.
What changed
The fix was not "more containers". It was less unnecessary work per request.
We audited which pages were actually using SSR and found that most of them didn't need it. The game itself is a fully client-rendered interactive app - SSR was adding cost without meaningful benefit for most routes. We removed SSR where it wasn't needed and pushed those pages to static or client-side rendering. The pages that still needed SSR kept it, but the overall request-path cost dropped dramatically.
This was not a rewrite. It was a practical reduction - identifying where SSR was being used by default and asking whether it was actually earning its cost.
Result
After the change, the difference in the charts was immediate. When comparable traffic came in - and in some cases, higher traffic than before - CPU stayed well below saturation. Memory dropped further. Network TX patterns looked normal. The service remained responsive throughout.
We just had to delete code that didn't need to be there.
All posts